 Crypto: Double Top and Double Bottom Strategy
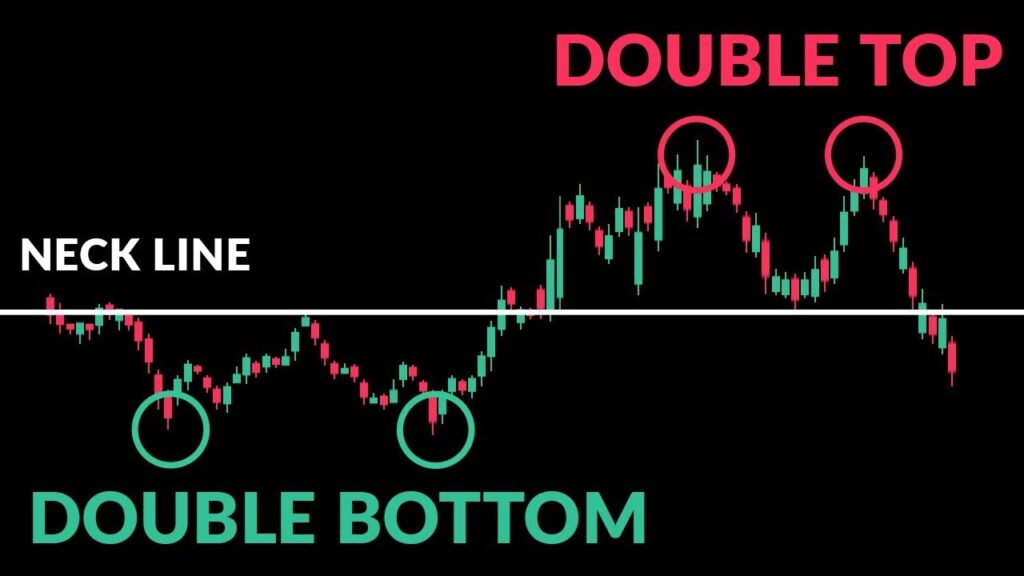
The Double Top and Double Bottom are common chart patterns in technical analysis used by traders to identify potential trend reversals. When applied to cryptocurrency trading, these patterns can offer insights into potential buy or sell signals, depending on the market conditions.
Understanding Double Top and Double Bottom Patterns
 1. Double Top Pattern:
– Formation: This pattern forms after an uptrend and consists of two consecutive peaks of similar height, separated by a trough (valley) in between.
– Signal: It indicates a potential reversal of the uptrend and suggests that the price may start to decline. Traders often look for a breakout below the trough (support level) as confirmation of a bearish trend.
2. Double Bottom Pattern:
– Formation: This pattern occurs after a downtrend and consists of two consecutive troughs (valleys) of similar depth, separated by a peak in between.
– Signal: It suggests a potential reversal of the downtrend and indicates that the price may start to rise. Traders typically wait for a breakout above the peak (resistance level) as confirmation of a bullish trend.
Trading Strategy Using Double Top and Double Bottom Patterns
1. Identifying the Patterns:
– Use price charts (such as candlestick charts) to identify potential Double Top or Double Bottom formations.
– Look for two consecutive highs (Double Top) or lows (Double Bottom) with a clear support or resistance level in between.
2. Confirmation:
– Wait for confirmation before entering a trade. For Double Top, confirmation occurs when the price breaks below the trough (support level). For Double Bottom, confirmation occurs when the price breaks above the peak (resistance level).
– Confirmation helps reduce false signals and increases the probability of a successful trade.
3. Entry and Exit Points:
– Entry: Enter a short position when the price breaks below the support level in a Double Top pattern. Enter a long position when the price breaks above the resistance level in a Double Bottom pattern.
– Exit: Set stop-loss orders to manage risk. Some traders use the height of the pattern (from peak to trough or trough to peak) to set profit targets.
4. Considerations:
– Volume: Volume can provide additional confirmation of the pattern. Ideally, volume should increase during the breakout, supporting the validity of the reversal.
– Timeframe: Patterns can vary in effectiveness depending on the timeframe (e.g., daily, hourly). Shorter timeframes may generate more frequent signals but could also be more prone to false signals.
5. Risk Management:
– Always use proper risk management techniques, such as setting stop-loss orders to limit potential losses if the trade does not go as expected.
– Avoid relying solely on patterns; consider incorporating other technical indicators or fundamental analysis to strengthen your trading decisions.
Example Scenario
– Scenario: You identify a Double Bottom pattern on the daily chart of Bitcoin (BTC/USD), where the price has formed two consecutive troughs with a peak in between.
– Confirmation: Wait for the price to break above the peak (resistance level) of the pattern.
– Entry: Enter a long position once the breakout occurs, with a stop-loss order set below the lowest point of the pattern.
– Exit: Take profit at a predetermined target, potentially based on the height of the pattern or other technical levels.
Timeframes and Pattern Reliability:
- Timeframes: Patterns can appear on various timeframes, from short-term charts (like 15-minute or hourly) to longer-term charts (daily or weekly). Consider the timeframe you are trading on, as shorter timeframes may produce more frequent signals but could be more prone to false breakouts.
- Pattern Reliability: Higher timeframe patterns (e.g., on daily or weekly charts) tend to be more reliable due to broader market participation and reduced noise compared to lower timeframes.
Conclusion
The Double Top and Double Bottom patterns are valuable tools for cryptocurrency traders seeking to identify potential trend reversals. By understanding how to recognize these patterns, confirm them with breakout signals, and manage risk effectively, traders can integrate these strategies into their overall trading approach to enhance decision-making and potentially capitalize on market opportunities.


